Category: Proval Temperature Mapping

  • Understanding Temperature mapping: Purpose, process, and Regulatory requirement 

    Understanding Temperature mapping: Purpose, process, and Regulatory requirement 

    Introduction 

    Nowadays, a large number of products need to be stored at a specific and constant temperature to keep them undamaged. 

    The process that is used to make sure that the products are stored at the required temperature is called temperature mapping.

    The first step in a temperature mapping study involves, practically, setting the required conditions for each item and then determining what causes them.

    This is the most critical study because it enables us to figure out how to store things more effectively, and so it guarantees that them to be in proper condition. 

    In this article, let’s understand what temperature mapping is and how it is performed.

    Purpose of Temperature Mapping 

    Temperature mapping (TM) is a process that helps validate the environmental control system:

    • Identify Temperature Deviations 

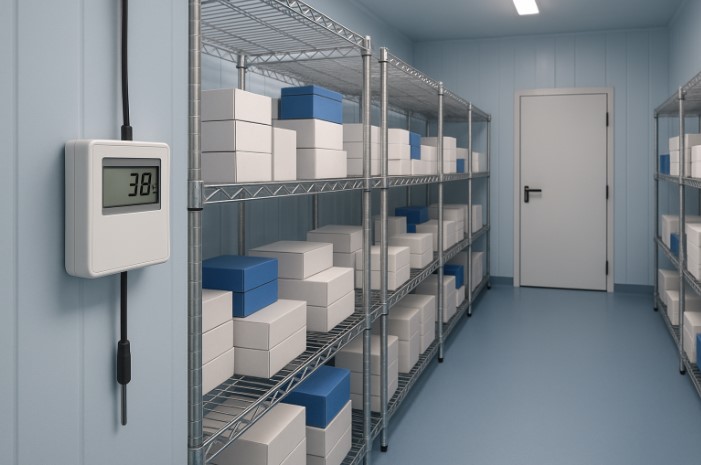
    The focus is to classify the Hot and Cold Spots in an area. These hot spots frequently occur due to structural concerns such as being adjacent to external walls, windows, cooling coils, heat generators, or poor airflow.

    •  Cold Spots: You will typically find them by cooling vents, refrigeration units, or exteriors in corners.
    • Hot Spots: Hot spots are commonly regarded as hot points.

    Found high up, like by lights, machines, or doors that get opened and closed frequently (say on a loading dock).

    • Establishing Uniformity And Performance 

    The mapping indicates that the storage unit can maintain proper temperatures irrespective of the surrounding conditions. This means that the design and the process function effectively. 

    Additionally, it also testifies that the region operates normally as expected while in use. The reason this is super because it indicates that the space is good enough for keeping materials that require a specific temperature.

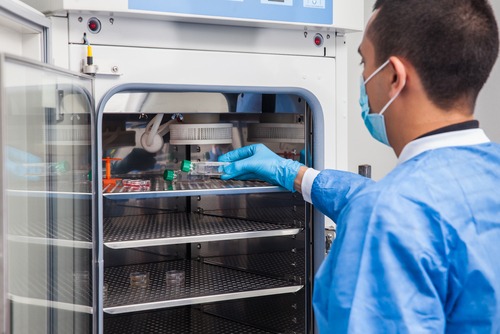
    • Sensor Placement Strategy 

    One of the most valuable things a good mapping study can do is pinpoint the best locations for permanent sensors.

    Sensors must be located where they would experience the extremes, including higher or lower temperature zones. This provides the greatest amount of protection for the stored commodity.

    • Risk Mitigation And Continuous Improvement 

    When temperature mapping is performed, the zones in which the performance of the environmental control system is not acceptable are identified. 

    This leads to the definition of quality from a risk-based standpoint. Namely, companies establish exclusion zones in which goods cannot be stored. 

    This also facilitates the development of scientifically-based corrective and preventive action to improve environmental control. Finally, this reduces risk due to loss of product or non-conformity.

    The Temperature Mapping Process 

    The following are the Four Steps to a Temperature Health Check:

    1. The Strategy Session

    You devise a plan first, which consists of:

    • Establishing the Range: Establish what the minimum and maximum acceptable cut-off points are. 
    • Locate the Danger Zones: You search for places where there is likely to be temperature trouble. This can be next to doors, vents, outdoor walls, or heaters.
    • Hiring the “Temperature Police”: Then you need to collect accurate digital data loggers. These devices should be newly certified, meaning you can have confidence in the readings they generate.

    2. The Stakeout

    You strategically sprinkle these loggers across the space in a 3D grid (top, mid, bottom, om, and center/edge). T, loggers are put right where those at-risk spots were pinpointed before. The exact location of each logger is meticulously logged.

    3. The Stress Test

    The loggers record data every few minutes over a period of some days or even weeks. To stress the system, you can:

    • You try the section while it is empty and when it’s at full inventory.
    • You “outrun” a power outage to find out how long the system temperatures are maintained.
    • You run the test in your hottest and coldest seasons to see how the climate is affecting it.

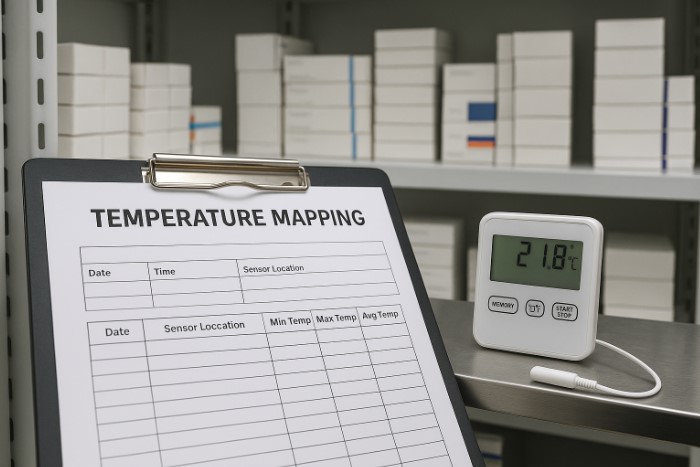
    4. The Final Report Card

    Then you analyze the data for the reality:

    • Hottest Spot.
    • Coldest Spot.

    Regulatory Requirements and Compliance:

    Temperature mapping is a core regulatory requirement in many GxP (Good Practice) environments.

    A. Key Regulatory Frameworks

    Regulatory BodyKey GuidelinesCompliance Requirement
    FDA (U.S.)21 CFR Part 210/211 (cGMP), 21 CFR 820.150 (Storage)Requires facilities to be designed, monitored, and controlled to prevent adulteration, including demonstrating control of environmental conditions for storage areas.
    WHOTechnical Supplement to Annex 9, TRS 961 (Temperature Mapping of Storage Areas)Emphasizes that all new temperature-controlled storage areas must be mapped as part of a fully documented verification process before commissioning.
    EU GMP/GDPAnnex 15 (Qualification and Validation), EU Good Distribution Practice (GDP) GuidelinesRequires initial mapping, seasonal mapping (unless risk-justified), and periodic re-mapping for all temperature-controlled storage and distribution areas.
    USPUSP  (Good Storage and Shipping Practices)Provides guidance on acceptable temperature ranges and the proper use and calculation of Mean Kinetic Temperature (MKT) to assess temperature excursions.

    ​B. Frequency and Re-qualification

    ​Regulatory guidelines generally require temperature mapping in the following circumstances:

    • Initial Qualification: Always needed for new storage areas, refrigerators, freezers, or newly designated storage zones.
    • Re-mapping (Re-qualification): That’s what happens when there’s a major change. This may influence the thermal signature. 

    This also includes a complete overhaul of the HVAC system, structural modifications to the area, changes in load patterns, or when the data tells us that there is a trend of non-uniformity coming our way. 

    The frequency should be based on risk. But internal SOPs frequently request or require a periodic re-qualification.

    C. Documentation and Auditing

    It is hard to overestimate the importance of the temperature mapping study, which should be both wide-ranging and detailed while being simple to check. 

    It is recommended that you retain all documentation with the location, protocol, raw data files of the entire batch, sensor calibration certificate, and final report,  along with CAPA plans filed as long as the storage area was in use. 

    Such information should also be available during regulatory on-site inspections. Throughout regulatory inspections, this is a generic challenge that often leads to severe compliance actions, including product recalls or plant closure.

    Conclusion 

    Temperature mapping is the key to keeping our temperature-sensitive products safe and effective. You might think of it as getting to know your storage areas intimately, knowing exactly how they work. 

    It’s not the case of taking one quick reading, but building a robust science-based program that deals with potential risks, by rigorously monitoring temperatures and following protocols established by the likes of the FDA, WHO, and EMA. 

    You need to make sure your system works well. A little prevention beforehand is a small price to pay for peace of mind and security down the road. It is about doing it right for everyone.

  • How Temperature Mapping Ensures Product Safety and Quality

    How Temperature Mapping Ensures Product Safety and Quality

    Introduction

    What do you think will happen to a vaccine or a life-saving drug if it’s stored at the wrong temperature? 

    Let me tell you. Having just even a few degrees off, even for a short time, can change everything. 

    Vaccines may lose potency, food may spoil faster, and pharmaceuticals may degrade before reaching patients.

    To ensure that no such thing happens, there is a process called temperature mapping. This process makes sure that every place has the desired temperature.

    It is the science behind keeping sensitive products safe and effective. Let me walk you through this article so that it becomes clear to you what temperature mapping is and why it is so important.  

    What Is Temperature Mapping?

    I will now tell you what temperature mapping is in a very simple way. It is a process that measures how the temperature should be inside a space, such as a warehouse or a cold room, over time.

    This process of mapping uses multiple calibrated data loggers, which are placed strategically across the area. It doesn’t use a single thermometer. 

    These sensors record temperature variations at every corner, top shelf, or near doorways and show hidden hot and cold zones.

    The goal is to make sure every single product, when stored, experiences the right environment throughout its shelf life.

    Why It Matters So Much

    Now, let us understand why temperature mapping matters so much. You should know that most of the medicines and food products we consume are temperature-sensitive. Even a small change in the temperature of these products can cause problems:

    • Pharmaceuticals can lose chemical stability.
    • Vaccines can lose their effect in extremely low or high temperatures.
    • Food products can develop harmful bacteria if the temperature is high.

    The World Health Organization (WHO) says that one in four vaccines worldwide gets wasted because of temperature-related problems during storage or transport.

    Because of this reason, regulatory authorities such as USP (<1079>), MHRA GDP, and WHO guidelines have made temperature mapping an important step for all controlled environments. 

    How Temperature Mapping Works

    The process of temperature mapping sounds complex, but it happens in steps. Below, I have mentioned how temperature mapping takes place: 

    StagePurposeWhat Happens
    PlanningDefine goals and risk areasDecide which rooms, freezers, or trucks need mapping, identify potential problem spots, and set acceptance criteria.
    ExecutionCapture real temperature behaviorPlace multiple data loggers across the area, record temperature data for 7–14 days under normal operating conditions.
    AnalysisUnderstand the dataIdentify hot or cold spots, temperature fluctuations, and deviations from the target range.
    Reporting and ActionsTurn insights into improvementsSuggest fixes such as adjusting airflow, relocating sensors, or insulating walls.
    Re-mappingConfirm long-term reliabilityRepeat the mapping after changes or during different seasons to ensure stability year-round.

    Most facilities conduct mapping twice a year, once in peak summer and once in winter, because external weather can significantly influence internal temperature behavior.

    What Makes Temperature Mapping So Valuable

    Now, let’s understand what the things are that make temperature mapping valuable: 

    BenefitWhy It Matters
    Protects Product IntegrityEnsures every product stays within its safe temperature range.
    Prevents Financial LossesAvoids product recalls, rejections, and spoilage.
    Enhances ComplianceMeets WHO, MHRA, and FDA audit expectations.
    Improves Energy EfficiencyIdentifies inefficient cooling zones or faulty HVAC systems.
    Optimizes MonitoringHelps place permanent temperature probes at the right locations.

    Best Practices for Accurate Temperature Mapping

    • Always use calibrated data loggers with traceable accuracy certificates. This ensures the readings you record are reliable. 
    • Then you should conduct mapping during normal operations, not when the facility is empty. Conducting the study during normal operations with products stored and equipment running provides real data about how the facility performs.
    • Always map during peak summer and winter because mapping during the hottest and coldest times of the year confirms that your system maintains stability throughout. This way, it will help you identify weak zones and will ensure consistent product safety no matter what the external weather is like.
    • You should keep analysing your data regularly, as simply recording it is not enough. MKT reflects overall thermal stress over time, while variance highlights unstable areas. 
    • Then make sure to document everything, including protocols and raw data, and follow-ups. You should always keep records of the study plan, calibration certificates, data logs, analysis, and corrective steps.
    • Temperature mapping should evolve with your operations. Repeat it after layout changes, equipment upgrades, or HVAC maintenance. Regular reviews and updates help maintain system reliability and continuous product protection.

    The Bigger Picture

    When we locate the whole process of departure mapping, it might sound like something technical, but I think it is just about putting your trust in the process.

    Whenever you use a vaccine or any packaged food, you trust that it has been stored safely and brought safely from the factory to your hands. 

    That trust is earned through science, which is temperature mapping. This process makes sure that every product maintains its quality and efficacy.

    Temperature mapping takes care of each and every product, whether it’s in a hospital pharmacy or a global logistics network.

    Conclusion

    To conclude the article, I will just say that temperature mapping is a promise that whatever is stored is safe and effective and will be shipped and administered as safely as the date it was made.

    Temperature mapping makes sure that the environment in a warehouse or transport truck is as per the requirements and protects human health and product quality. 

    Because in the end, these products are very sensitive, and even a few degrees of change can make these products harmful and ineffective. 

  • The Science Behind Temperature Mapping: Key Steps and Best Practices

    The Science Behind Temperature Mapping: Key Steps and Best Practices

    Introduction

    You know, places like pharmaceutical warehouses, hospital storage rooms, etc, have to maintain a required temperature before they start anything. 

    The process that allows them to maintain the required temperature is called temperature mapping. It is a scientific way that makes sure that every corner of the storage space is maintained at the right temperature.

    In cold rooms of freezers, some areas might be slightly warmer or cooler, and you won’t be able to know it until you measure the temperature of all of the areas.

    So it is really important to make sure all areas have the required temperature and the temperature does not vary at any place. 

    To make sure that we have the required temperature in the desired area, we follow temperature mapping. It helps in finding varying temperature spots in the area so that the medicines or samples are at the right temperature.

    What Is Temperature Mapping

    I will now tell you what temperature mapping is in a very simple way. It is a process that measures how the temperature should be inside a space, such as a warehouse or a cold room, over time.

    This process of mapping uses multiple calibrated data loggers, which are placed strategically across the area. It doesn’t use a single thermometer. 

    These sensors record temperature variations at every corner, top shelf, or near doorways and show hidden hot and cold zones.

    The goal is to make sure every single product, when stored, experiences the right environment throughout its shelf life.

    Scientific InsightWhat It Means Practically
    Temperature affects reaction ratesEven small fluctuations can degrade sensitive drugs
    Air circulation patterns varyCorners or door zones may get warmer or cooler
    Sensor accuracy mattersA miscalibrated logger gives false assurance
    Heat sources shift over timeMapping needs repeating when layouts change

    Why It’s Important in Pharma and Biotech

    There are industries that deal with vaccines, biologics, or lab reagents. Here, keeping the right temperature is the most important. 

    Agencies like the WHO, ISPE, and FDA require temperature mapping to make sure your HVAC or refrigeration system works in the way it’s supposed to work.

    Let’s say your warehouse needs to maintain between 2°C and 8°C. You can do so by using temperature mapping. This process makes sure that you have your required temperature around every shelf and corner of the area throughout the day and night. 

    In the end, it’s about protecting patients and the integrity of everything you store.

    The Step-by-Step Science of Temperature Mapping

    Step 1: Define What You’re Testing

    To start the temperature mapping, first, you need to identify what you are testing. You need to figure out the area or equipment you have to validate.

    Then you have to set your temperature range, for example, 2–8 °C, and note where risks might be higher.

    Step 2: Design a Smart Protocol

    Before beginning, plan your study.
    Decide:

    • How many sensors to use (at least nine for small rooms)
    • Where to place them (top, middle, bottom, and corners)
    • How long to record (24 hours to 7 days, depending on the space)
    • What conditions to test (door open/closed, power on/off, full vs empty load)
    ParameterTypical RangeExample
    Study duration24 hrs – 7 days48 hrs for a small room
    Data-logging interval1 – 5 min1 min gives more precise results
    Number of sensors9 – 30+Larger warehouses need more


    Step 3:Execute the Study

    • Place your calibrated data loggers according to the plan.
    • Keep the facility running under normal operating conditions.
    • Also, always record external factors like door openings and nearby temperature changes.

    Step 4: Analyze the Data

    • After you have collected your data, I suggest analysing it carefully. 
    • While analysing, look for minimum and maximum temperatures and the areas that go out of range. 
    • Also, notice how quickly temperatures recover after disturbance.
    • The goal is to convert raw readings into clear insights about airflow, insulation, and system performance.

    Step 5: Validate and Report

    • Compare your results against your acceptance limits.
    • If readings are within range, your system is validated.
    • If your readings are not in the range, then you should investigate and correct issues.

    Step 6: Keep Monitoring

    • Temperature mapping is not just a one-time process.
    • You need to keep monitoring your area.
    • You should re-map after major layout or equipment changes, or whenever seasonal temperature variations affect performance. 
    • Most facilities repeat mapping every one to three years.

    Best Practices and Common Pitfalls

    Always follow these practices for a perfect temperature mapping process:

    • Always use calibrated data loggers with traceable accuracy certificates. This ensures the readings you record are reliable. 
    • Then you should conduct mapping during normal operations, not when the facility is empty. Conducting the study during normal operations with products stored and equipment running provides real data about how the facility performs.
    • Always map during peak summer and winter because mapping during the hottest and coldest times of the year confirms that your system maintains stability throughout. This way, it will help you identify weak zones and will ensure consistent product safety no matter what the external weather is like.
    • You should keep analysing your data regularly, as simply recording it is not enough. MKT reflects overall thermal stress over time, while variance highlights unstable areas. 
    • Then make sure to document everything, including protocols and raw data, and follow-ups. You should always keep records of the study plan, calibration certificates, data logs, analysis, and corrective steps.
    • Temperature mapping should evolve with your operations. Repeat it after layout changes, equipment upgrades, or HVAC maintenance. Regular reviews and updates help maintain system reliability and continuous product protection.

    Common Pitfalls

    MistakeWhy It’s a ProblemHow to Fix It
    Too few sensorsMisses critical zonesFollow ISPE or WHO guidelines
    Ignoring the external climateSkews readingsRecord the ambient temperature, too
    Using old mapping dataCauses audit non-complianceRe-map after layout or season changes
    Overlooking humidityAffects product stabilityMonitor both temperature and humidity

    A Quick Example

    Here is how a small cold room (target 2–8 °C) might perform during a mapping study:

    Sensor LocationMin (°C)Max (°C)Status
    Door area1.88.9Out of range
    Center3.27.1Within range
    Rear top2.67.8Within range
    Rear bottom1.58.3Low excursion

    The results show that the door area allows warm air ingress, and the bottom rear gets too cold. These insights help you make precise corrections.

    Conclusion

    To conclude this article, I’ll say that temperature mapping is a scientific and data-driven method to ensure that the products stay safe and efficient. 

    When this process is followed correctly, it meets all the regulatory expectations and also strengthens quality assurance. 

    You should understand that temperature mapping is your storage system’s Health check. It makes sure that your equipment performs as it is required to, and it keeps every while or product as stable as the day it was made.

  • A Complete Guide to Temperature Mapping in Pharmaceutical Facilities

    A Complete Guide to Temperature Mapping in Pharmaceutical Facilities

    Introduction

    What comes to your mind when you think about the requirements of the pharmaceutical industry? You must have thought about hygiene and cleanliness. 

    You’re not wrong. It is one of the biggest criteria, but did you know that the right temperature is also important?

    Having the correct temperature while the products are being made is a very important requirement. A lot of medicinal products and other biological products are sensitive to temperature.

    To make sure that the temperature stays within the required and recommended range, temperature mapping is used. It makes sure that every part of your required area stays within the required temperature.

    Mapping of temperature is also a part of Good Manufacturing Practices (GMP) and Good Distribution Practices (GDP).

    What Is Temperature Mapping?

    A temperature mapping is a technique that informs about the uniformity of the distribution of temperature within a controlled area.

    It works by using a range of multiple sensors placed around a space (such as a warehouse, cold room, or fridge) to build a map of when and why the temperature in certain areas gets warmer or cooler than it’s supposed to.

    These aren’t just temperature spot checks. You’re tracking real data across time and space to make sure no product ends up in a “hot” or “cold” zone that could make it unwanted.

    It’s used everywhere, from massive distribution warehouses to tiny benchtop fridges. If a space stores temperature-sensitive products, mapping is the first step to making sure it’s suitable.

    Why Temperature Mapping Matters

    If you’re working in pharma, you already know that temperature excursions can spell disaster. For things like biologics and vaccines, even short exposure to out-of-range conditions can break down efficacy.

    But it’s not just about product safety; it’s also a compliance thing. Regulators expect proof that your storage spaces are up to the job, not just good intentions.

    What Do the Regulations Say?

    You can’t talk about validation without touching on regulations. And when it comes to temperature mapping, the expectations are crystal clear:

    AuthorityWhat They Expect
    WHO (TRS Annex 9)Mapping before first use, re-map every 2–3 years or after changes
    FDA (21 CFR 211)Prove that environmental conditions won’t affect product quality
    USP <1079.4> (draft)Establishes best practices for mapping vs. monitoring
    GDP, EMA, MHRAExpect documented qualification of all storage spaces

    How to Perform a Temperature Mapping Study

    Let’s break it down step by step.

    a. Create a Protocol

    Before you hang a single sensor, start with a plan. Your protocol should include:

    • The goal of the study
    • The space being mapped.
    • What temperature range are you validating for (e.g., 2–8°C)
    • How long the study will run (48–72 hours is common)
    • Where sensors will go, and how many you’ll use
    • Calibration details for every sensor

    Think of it as the blueprint for the whole study.

    b. Choose the Right Number and Placement of Sensors

    You don’t want to under-sample. More sensors = better visibility. Here’s a rough guide:

    Sensor PlacementWhy It Matters
    High/mid/low levelsTemperatures stratify vertically
    Corners and centerCatch edge effects or thermal layering
    Near doors and ventsDetect external temperature influences
    Inside racks or storage binsReal conditions where products live
    One sensor per 5–10 m²Adjust based on layout and risk

    c. Run the Study

    Once everything is set, deploy the sensors and let the study run uninterrupted. Keep the doors shut as much as possible unless you’re testing door-open scenarios.

    For large facilities or ones exposed to seasonal swings, you might want to map in both summer and winter to get worst-case data.

    Keep an event log, too. If anything unusual happens (power outage, door jammed open), note it. It’ll help explain any anomalies later.

    d. Analyze and Report

    Now comes the fun part: turning data into insight.

    • Look at min/max temperatures per sensor.
    • Identify any hot or cold spots.
    • Use graphs or heatmaps to visualize the spread.
    • Calculate Mean Kinetic Temperature (MKT) if applicable.
    • Compare everything to your acceptance criteria.

    Another WHO case saw a cold room fail mapping because the temperature controller range was too wide. By adjusting the setpoint, the room stabilized, and a second mapping confirmed it was back within spec.

    All findings should go into a formal report. Include everything from sensor positions and raw data to conclusions and any corrective actions.

    Best Practices for Successful Mapping

    Here’s what we’ve learned over the years:

    • Don’t skimp on sensors. More data is better.
    • Calibrate every sensor. No shortcuts here.
    • Map under real conditions. Loaded vs. empty, door-open scenarios, seasonal swings.
    • Map before first use, and again after changes. New cooling unit? Re-map it.
    • Document everything. Your protocol, calibration certificates, raw logs, and final report.

    Oh, and use the data to guide where you place your permanent monitoring probes. It’s a smart way to future-proof your setup.

    Conclusion

    Monitoring tells you if your system is staying in range today.

    It’s your proof that the space was qualified before the first product ever hit the shelf. And it’s your safety net against hidden risks, like the “perfect-looking” cold room that’s quietly cooking one corner.

    So if you’ve just commissioned a new facility, replaced a cooling system, or haven’t mapped in years, it’s time.

    Start with a protocol. Use trusted loggers. Map it, analyze it, and make sure your storage areas are as controlled as they look on paper.

    Temperature mapping isn’t just a task; it’s your best insurance policy.