

The Science Behind Temperature Mapping: Key Steps and Best Practices
07 Nov, 2025
Introduction
You know, places like pharmaceutical warehouses, hospital storage rooms, etc, have to maintain a required temperature before they start anything.
The process that allows them to maintain the required temperature is called temperature mapping. It is a scientific way that makes sure that every corner of the storage space is maintained at the right temperature.
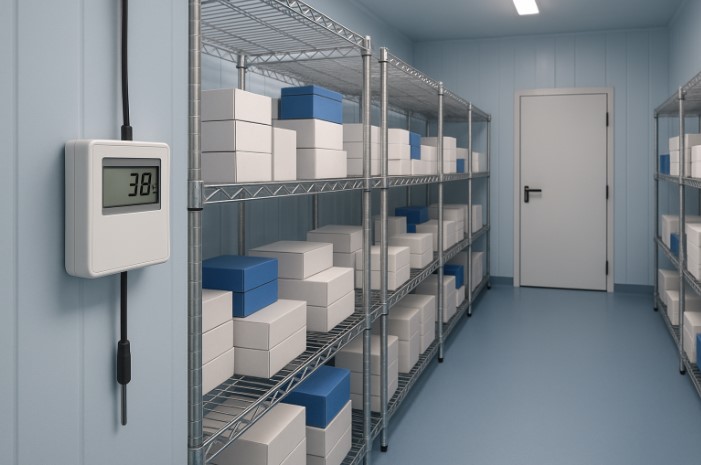
In cold rooms of freezers, some areas might be slightly warmer or cooler, and you won’t be able to know it until you measure the temperature of all of the areas.
So it is really important to make sure all areas have the required temperature and the temperature does not vary at any place.
To make sure that we have the required temperature in the desired area, we follow temperature mapping. It helps in finding varying temperature spots in the area so that the medicines or samples are at the right temperature.
What Is Temperature Mapping
I will now tell you what temperature mapping is in a very simple way. It is a process that measures how the temperature should be inside a space, such as a warehouse or a cold room, over time.
This process of mapping uses multiple calibrated data loggers, which are placed strategically across the area. It doesn’t use a single thermometer.
These sensors record temperature variations at every corner, top shelf, or near doorways and show hidden hot and cold zones.
The goal is to make sure every single product, when stored, experiences the right environment throughout its shelf life.
| Scientific Insight | What It Means Practically |
| Temperature affects reaction rates | Even small fluctuations can degrade sensitive drugs |
| Air circulation patterns vary | Corners or door zones may get warmer or cooler |
| Sensor accuracy matters | A miscalibrated logger gives false assurance |
| Heat sources shift over time | Mapping needs repeating when layouts change |
Why It’s Important in Pharma and Biotech
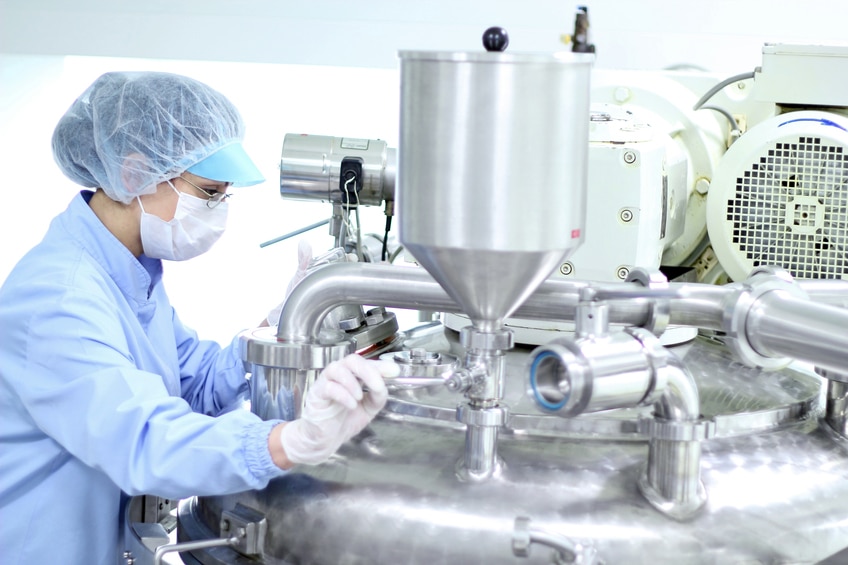
There are industries that deal with vaccines, biologics, or lab reagents. Here, keeping the right temperature is the most important.
Agencies like the WHO, ISPE, and FDA require temperature mapping to make sure your HVAC or refrigeration system works in the way it’s supposed to work.
Let’s say your warehouse needs to maintain between 2°C and 8°C. You can do so by using temperature mapping. This process makes sure that you have your required temperature around every shelf and corner of the area throughout the day and night.
In the end, it’s about protecting patients and the integrity of everything you store.
The Step-by-Step Science of Temperature Mapping
Step 1: Define What You’re Testing
To start the temperature mapping, first, you need to identify what you are testing. You need to figure out the area or equipment you have to validate.
Then you have to set your temperature range, for example, 2–8 °C, and note where risks might be higher.
Step 2: Design a Smart Protocol
Before beginning, plan your study.
Decide:
- How many sensors to use (at least nine for small rooms)
- Where to place them (top, middle, bottom, and corners)
- How long to record (24 hours to 7 days, depending on the space)
- What conditions to test (door open/closed, power on/off, full vs empty load)
| Parameter | Typical Range | Example |
| Study duration | 24 hrs – 7 days | 48 hrs for a small room |
| Data-logging interval | 1 – 5 min | 1 min gives more precise results |
| Number of sensors | 9 – 30+ | Larger warehouses need more |
Step 3:Execute the Study
- Place your calibrated data loggers according to the plan.
- Keep the facility running under normal operating conditions.
- Also, always record external factors like door openings and nearby temperature changes.
Step 4: Analyze the Data
- After you have collected your data, I suggest analysing it carefully.
- While analysing, look for minimum and maximum temperatures and the areas that go out of range.
- Also, notice how quickly temperatures recover after disturbance.
- The goal is to convert raw readings into clear insights about airflow, insulation, and system performance.
Step 5: Validate and Report
- Compare your results against your acceptance limits.
- If readings are within range, your system is validated.
- If your readings are not in the range, then you should investigate and correct issues.
Step 6: Keep Monitoring
- Temperature mapping is not just a one-time process.
- You need to keep monitoring your area.
- You should re-map after major layout or equipment changes, or whenever seasonal temperature variations affect performance.
- Most facilities repeat mapping every one to three years.
Best Practices and Common Pitfalls
Always follow these practices for a perfect temperature mapping process:
- Always use calibrated data loggers with traceable accuracy certificates. This ensures the readings you record are reliable.
- Then you should conduct mapping during normal operations, not when the facility is empty. Conducting the study during normal operations with products stored and equipment running provides real data about how the facility performs.
- Always map during peak summer and winter because mapping during the hottest and coldest times of the year confirms that your system maintains stability throughout. This way, it will help you identify weak zones and will ensure consistent product safety no matter what the external weather is like.
- You should keep analysing your data regularly, as simply recording it is not enough. MKT reflects overall thermal stress over time, while variance highlights unstable areas.
- Then make sure to document everything, including protocols and raw data, and follow-ups. You should always keep records of the study plan, calibration certificates, data logs, analysis, and corrective steps.
- Temperature mapping should evolve with your operations. Repeat it after layout changes, equipment upgrades, or HVAC maintenance. Regular reviews and updates help maintain system reliability and continuous product protection.
Common Pitfalls
| Mistake | Why It’s a Problem | How to Fix It |
| Too few sensors | Misses critical zones | Follow ISPE or WHO guidelines |
| Ignoring the external climate | Skews readings | Record the ambient temperature, too |
| Using old mapping data | Causes audit non-compliance | Re-map after layout or season changes |
| Overlooking humidity | Affects product stability | Monitor both temperature and humidity |
A Quick Example
Here is how a small cold room (target 2–8 °C) might perform during a mapping study:
| Sensor Location | Min (°C) | Max (°C) | Status |
| Door area | 1.8 | 8.9 | Out of range |
| Center | 3.2 | 7.1 | Within range |
| Rear top | 2.6 | 7.8 | Within range |
| Rear bottom | 1.5 | 8.3 | Low excursion |
The results show that the door area allows warm air ingress, and the bottom rear gets too cold. These insights help you make precise corrections.
Conclusion
To conclude this article, I’ll say that temperature mapping is a scientific and data-driven method to ensure that the products stay safe and efficient.
When this process is followed correctly, it meets all the regulatory expectations and also strengthens quality assurance.
You should understand that temperature mapping is your storage system’s Health check. It makes sure that your equipment performs as it is required to, and it keeps every while or product as stable as the day it was made.