

A Complete Guide to Temperature Mapping in Pharmaceutical Facilities
24 Oct, 2025
Introduction
What comes to your mind when you think about the requirements of the pharmaceutical industry? You must have thought about hygiene and cleanliness.
You’re not wrong. It is one of the biggest criteria, but did you know that the right temperature is also important?
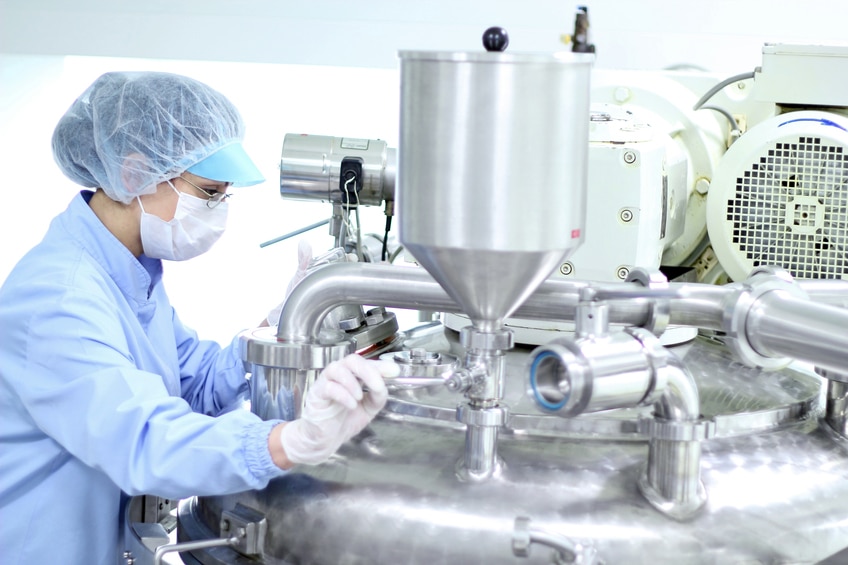
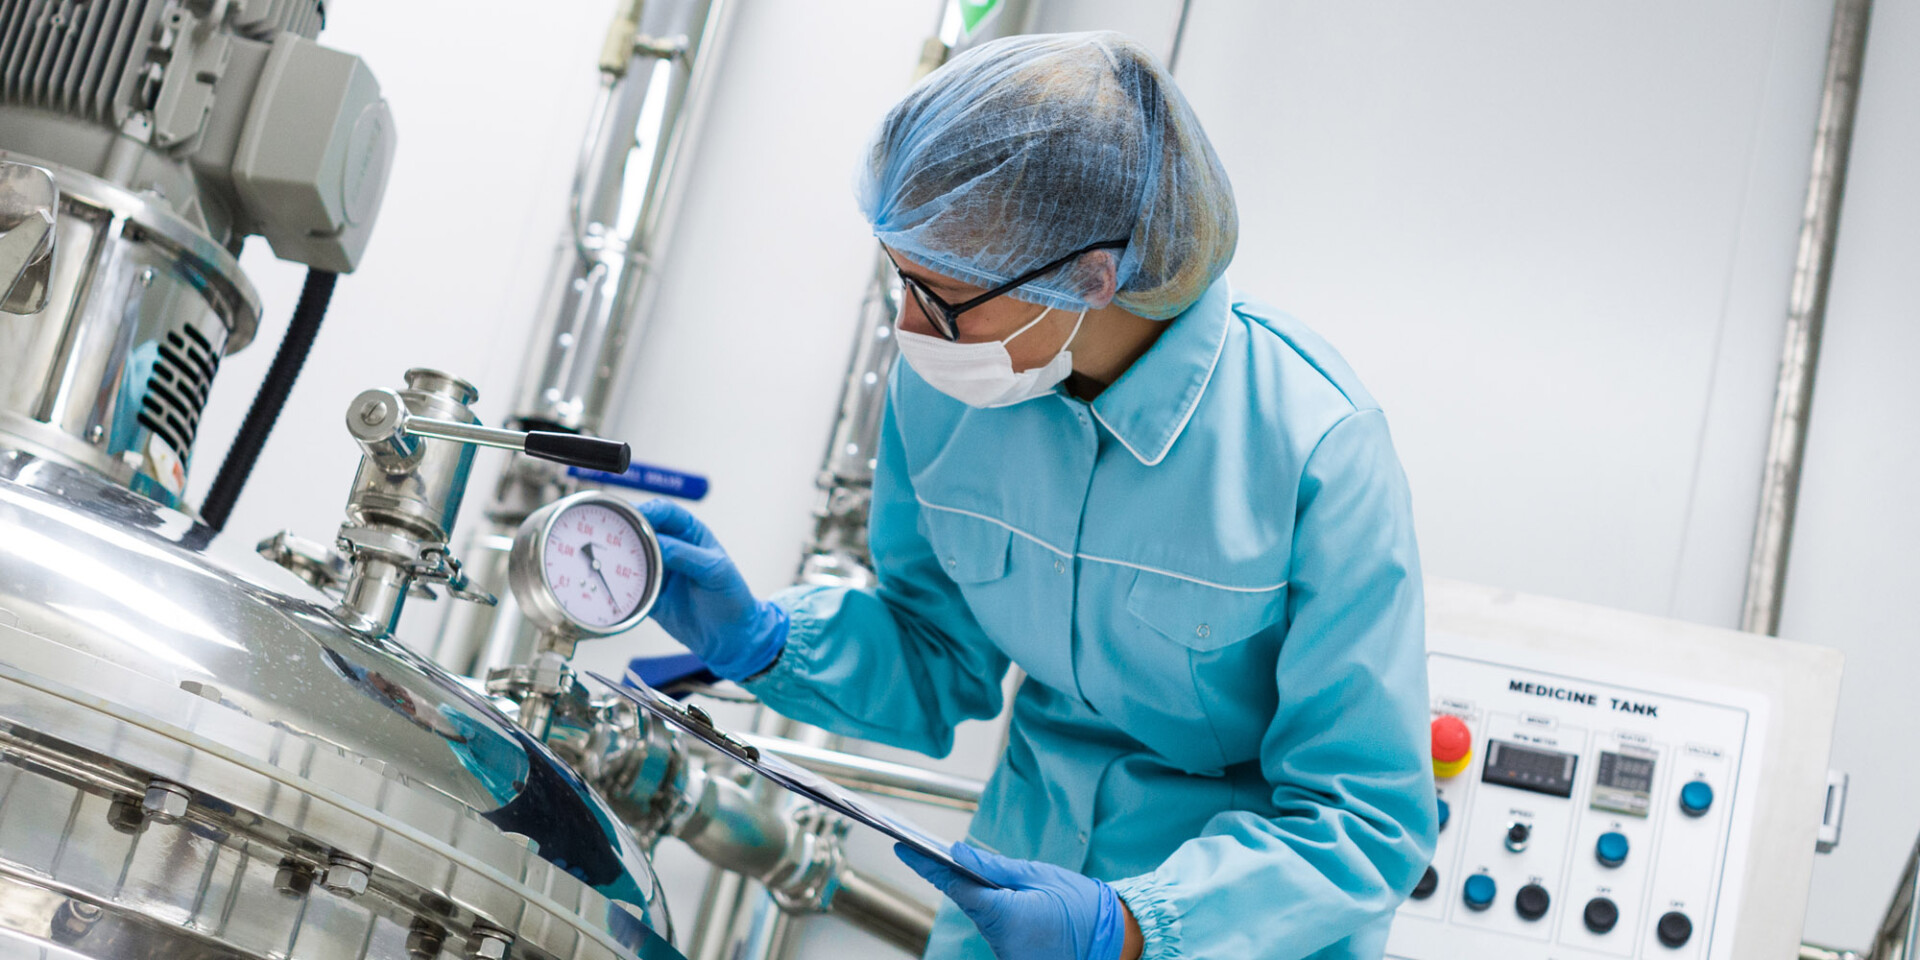
Having the correct temperature while the products are being made is a very important requirement. A lot of medicinal products and other biological products are sensitive to temperature.
To make sure that the temperature stays within the required and recommended range, temperature mapping is used. It makes sure that every part of your required area stays within the required temperature.
Mapping of temperature is also a part of Good Manufacturing Practices (GMP) and Good Distribution Practices (GDP).
What Is Temperature Mapping?
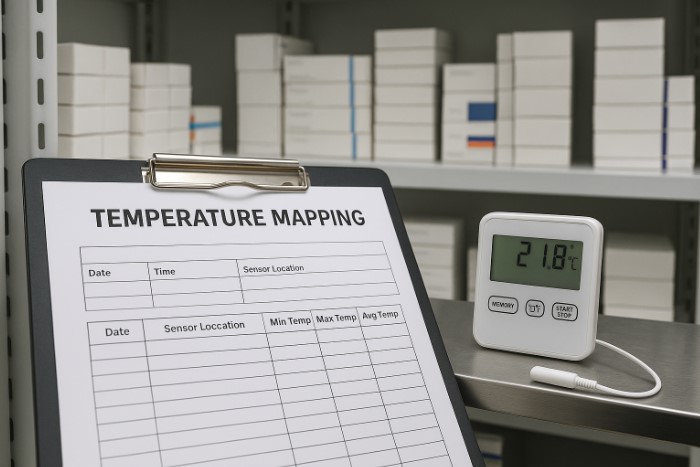
A temperature mapping is a technique that informs about the uniformity of the distribution of temperature within a controlled area.
It works by using a range of multiple sensors placed around a space (such as a warehouse, cold room, or fridge) to build a map of when and why the temperature in certain areas gets warmer or cooler than it’s supposed to.
These aren’t just temperature spot checks. You’re tracking real data across time and space to make sure no product ends up in a “hot” or “cold” zone that could make it unwanted.
It’s used everywhere, from massive distribution warehouses to tiny benchtop fridges. If a space stores temperature-sensitive products, mapping is the first step to making sure it’s suitable.
Why Temperature Mapping Matters
If you’re working in pharma, you already know that temperature excursions can spell disaster. For things like biologics and vaccines, even short exposure to out-of-range conditions can break down efficacy.
But it’s not just about product safety; it’s also a compliance thing. Regulators expect proof that your storage spaces are up to the job, not just good intentions.
What Do the Regulations Say?
You can’t talk about validation without touching on regulations. And when it comes to temperature mapping, the expectations are crystal clear:
| Authority | What They Expect |
| WHO (TRS Annex 9) | Mapping before first use, re-map every 2–3 years or after changes |
| FDA (21 CFR 211) | Prove that environmental conditions won’t affect product quality |
| USP <1079.4> (draft) | Establishes best practices for mapping vs. monitoring |
| GDP, EMA, MHRA | Expect documented qualification of all storage spaces |
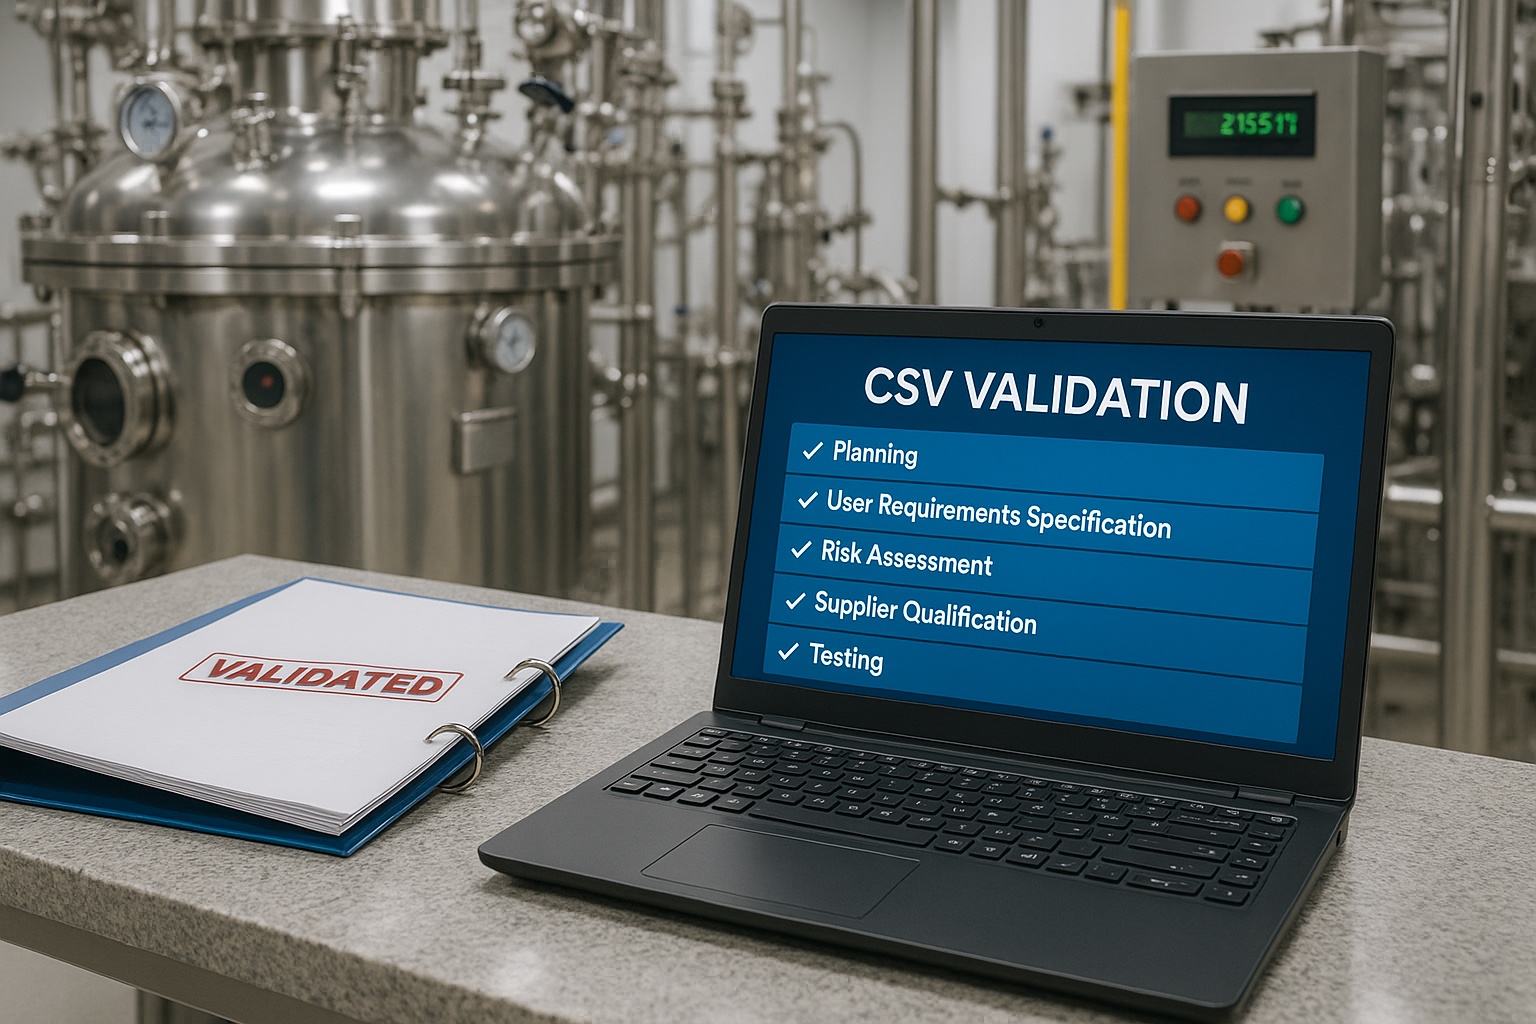
How to Perform a Temperature Mapping Study
Let’s break it down step by step.
a. Create a Protocol
Before you hang a single sensor, start with a plan. Your protocol should include:
- The goal of the study
- The space being mapped.
- What temperature range are you validating for (e.g., 2–8°C)
- How long the study will run (48–72 hours is common)
- Where sensors will go, and how many you’ll use
- Calibration details for every sensor
Think of it as the blueprint for the whole study.
b. Choose the Right Number and Placement of Sensors
You don’t want to under-sample. More sensors = better visibility. Here’s a rough guide:
| Sensor Placement | Why It Matters |
| High/mid/low levels | Temperatures stratify vertically |
| Corners and center | Catch edge effects or thermal layering |
| Near doors and vents | Detect external temperature influences |
| Inside racks or storage bins | Real conditions where products live |
| One sensor per 5–10 m² | Adjust based on layout and risk |
c. Run the Study
Once everything is set, deploy the sensors and let the study run uninterrupted. Keep the doors shut as much as possible unless you’re testing door-open scenarios.
For large facilities or ones exposed to seasonal swings, you might want to map in both summer and winter to get worst-case data.
Keep an event log, too. If anything unusual happens (power outage, door jammed open), note it. It’ll help explain any anomalies later.
d. Analyze and Report
Now comes the fun part: turning data into insight.
- Look at min/max temperatures per sensor.
- Identify any hot or cold spots.
- Use graphs or heatmaps to visualize the spread.
- Calculate Mean Kinetic Temperature (MKT) if applicable.
- Compare everything to your acceptance criteria.
Another WHO case saw a cold room fail mapping because the temperature controller range was too wide. By adjusting the setpoint, the room stabilized, and a second mapping confirmed it was back within spec.
All findings should go into a formal report. Include everything from sensor positions and raw data to conclusions and any corrective actions.
Best Practices for Successful Mapping
Here’s what we’ve learned over the years:
- Don’t skimp on sensors. More data is better.
- Calibrate every sensor. No shortcuts here.
- Map under real conditions. Loaded vs. empty, door-open scenarios, seasonal swings.
- Map before first use, and again after changes. New cooling unit? Re-map it.
- Document everything. Your protocol, calibration certificates, raw logs, and final report.
Oh, and use the data to guide where you place your permanent monitoring probes. It’s a smart way to future-proof your setup.
Conclusion
Monitoring tells you if your system is staying in range today.
It’s your proof that the space was qualified before the first product ever hit the shelf. And it’s your safety net against hidden risks, like the “perfect-looking” cold room that’s quietly cooking one corner.
So if you’ve just commissioned a new facility, replaced a cooling system, or haven’t mapped in years, it’s time.
Start with a protocol. Use trusted loggers. Map it, analyze it, and make sure your storage areas are as controlled as they look on paper.
Temperature mapping isn’t just a task; it’s your best insurance policy.